
Bullish Percent Index
Semiconductors
Week Ending 12/27/24
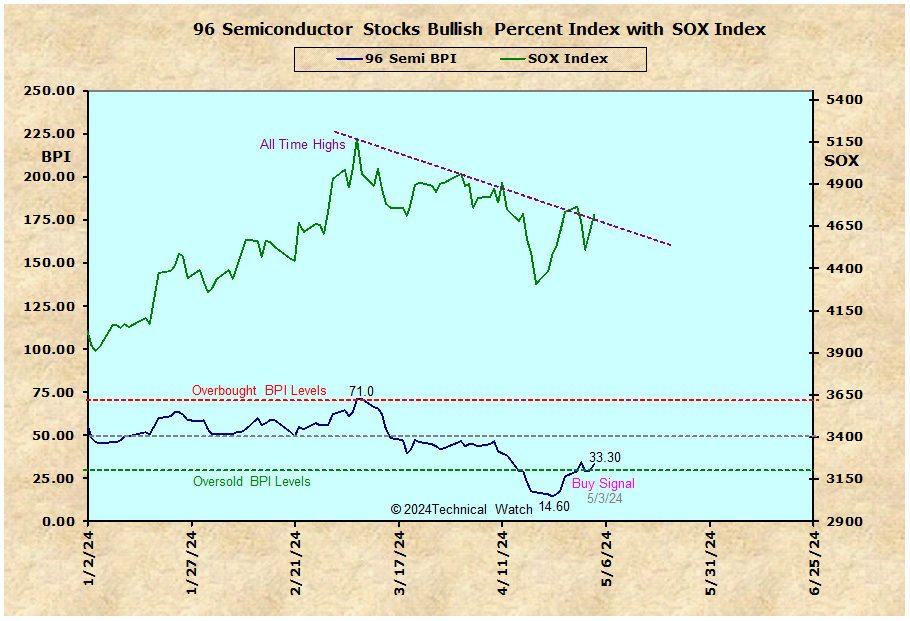
The Bullish Percent Index (BPI) is another way to look at market breadth, or money flow, and can therefore be a useful tool to measure sentiment as well.
The BPI is calculated by dividing a basket of stocks in a given group or index that are on buy signals - based on a charting method known as "Point and Figure" - by the total number of stocks in this same group or index.
Percentage readings above the 70% level would be considered "overbought", while readings below the 30% level would be considered "oversold" as it would pertain to each group or index individually. A classic BPI buy signal is generated when the "bullish percent" moves below the 30% level and then reverses up by at least 6%, while a BPI sell signal is generated when the "bullish percent" moves above the 70% level and then reverses down by at least 6%.
Further information on Point and Figure charting and the Bullish Percent Index can be found at Dorsey, Wright & Associates and in the books shown below.
Make a Donation!
If you find this bullish percent semiconductor chart useful, please consider making
a donation to Technical Watch to keep this information available in the future.
All donations go towards web site maintenance for all of Technical Watch,
keep it free of charge, and may be tax deductible as an investment expense.
This chart will be updated every weekend.
Comments provided are for informational purposes only
and not intended for trading purposes.
 Back to Top
Home Page
Back to Top
Home Page
Copyright © 2000-2024 Technical Watch