
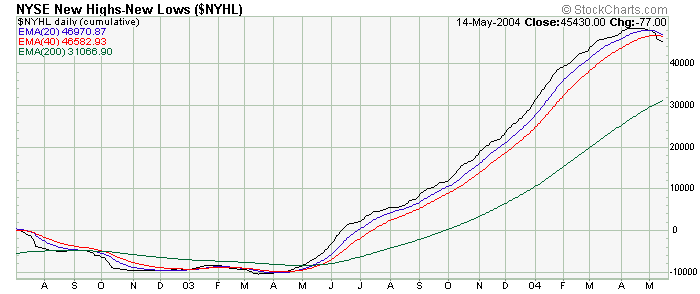
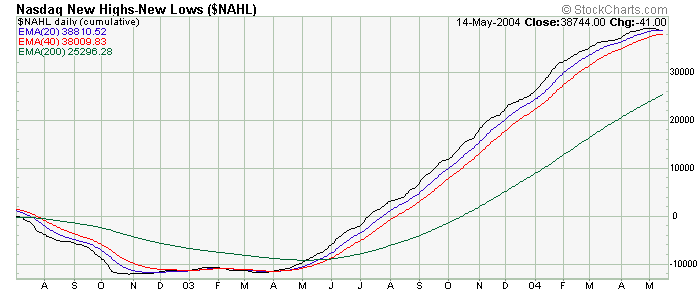
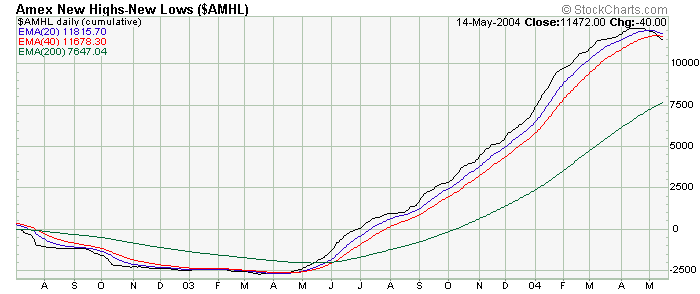
Cumulative Data
Week Ending 5/14/04
"Near term though, I would expect next week to be quite volatile as we look to set a short term price bottom, and where the major indices will play tag with their respective 200 day EMA's during this process."
So far, so good, as the market continues to follow what the cumulative data had suggested what would actually take place last week.
But now the easy part is behind us, with the marketplace now in control of it's short term destiny, or a key juncture.
Like price, the cumulative charts are also playing tag with their own 1% trends (200 day EMA's), with the NASDAQ market looking rather weak as far as overall investor participation.
This is a concern for the market as a whole as with any directional price move we want to see the growth stocks (NASDAQ) leading those with "perceived" value (NYSE).
With the growth area not being able to find investor support currently, this would then suggest that additional corrective action might well be in the cards near term, which would also be consistent to what other momentum technical indicators are suggesting at this time...as we've continued to see further breakdowns in this area over the last week.
In other words, if we don't start seeing fresh money supporting the market fairly soon, the price 200 day EMA's are more than likely not going to hold this near term support, and this would then open the door for the market to trade back down to their respective lows of last fall as the next minimal technical expectation.
On the other hand, the recent decline of the cumulative A/D has now brought the 10% and 5% trends at or near their 1% trends. If the last couple of months of corrective action is but a short term market breather, a move slightly below the 1% trend of the 10% and 5% trends, and then a quick move back above these same "trend" lines, would then signify that the corrective process has done what was needed to clear out any excesses that may had come before, and a new price rally attempt should then be seen.
The bad news for the bulls now is that the breadth NYSE McClellan Summation Index has now been able to take out it's October 2002 lows suggesting, minimally speaking, that a more pronounced intermediate term correction is indeed underway. On the other hand, the volume MCSUM has not done the same thing, and continues to look constructive.
This would suggest that there is still plenty of monetary liquidity out there to hold the market up at these levels, but some outside influence is keeping the market preoccupied.
In this particular case, our problem probably lies with the oil sector where both company profits, as well as personal consumer usage, can have a negative impact on equities overall.
So we may move lower in reaction to any continuation of higher energy prices, but we could also trade net sideways as well if we see this sector show some corrective action near term where a new constructive base can then develope in which to rally importantly later on an intermediate term basis.
The bad news for the bears is that the breadth MCSUM's for both the NYSE and the NASDAQ (-726 and -689 respectively) are now approaching the -750 level which is where the market usually finishes its corrective action and where a turn up in this indicator could then occur at any time.
However, on a shorter term basis, the breadth versions of the McClellan Oscillator look as though that a more complex bottom is needed before a move above the zero line is likely to occur, and this could take another couple of weeks for this to happen which, in turn, increases the probability that the MCSUM is going to move closer to the -1000 level before the market has been fully cleansed to build a better foundation to move higher overall.
It's also important to understand that with the MCSUM being at such low levels, along with the components of the oscillator itself at levels in which are over extended, it's going to be more difficult for price to decline, and more importantly, continue to decline from this current juncture as well.
The bottom line this week is that we are at a key near term juncture, where a close below the price 200 day EMA's should be expected in the next couple of days, but from where we will probably see some firmness, if not close higher on the week when all is said and done. Watching indicators such as the daily TRIN and the various volatility and sentiment indicators (like the VIX and put/call ratios) should provide enough evidence of whether a short term bottom is in, or a test of last fall's lows will be the new price objective over the next several weeks.


The above charts are courtesy of StockCharts.com
Comments provided are for informational purposes only
and not intended for trading purposes.
 Back to Top
Home Page
Back to Top
Home Page
Copyright © 2002-2004 Technical Watch