
Cumulative Data
Week Ending 5/28/04
"So, it would seem that this "key juncture" will continue for another week, with a sharp sell off in the beginning of the week and then further firmness going into the holiday weekend the preferred forecast for the near term, but do keep in mind that just about all of the necessary corrective work has already been done where the market could turn up at any time."
Hmmmm...well, so much for my "preferred" view on things.
The NYSE cumulative advance decline breadth and volume charts have now given "on your marks" technical buy signals by both moving up above their 10%, and more importantly, their 5% trend index' as well. The sheer strength that would be needed to make such a move produced a new all time high reading on the traditional breadth NYSE McClellan Oscillator with a reading of +318. And though a high reading like this is interesting to note as it was when the traditional NYSE McClellan Summation Index also generated a new all time reading last June, this is where using a set number of 1000 stocks - as the ratio adjusted MCO and MCSUM produces - becomes more important in order to compare such raw traditional readings on a historical basis. But even there, with a reading of +96 on the ratio adjusted breadth oscillator, this still ranks as being one of the top 10 readings of the last 30 years, if not longer.
Even more exciting is the fact that the entire market enjoyed this onslaught of fresh capital that came in last week as represented by the NASDAQ and AMEX cumulative data charts shown below, with the NASDAQ cumulative breadth bringing up the rear thus far.
All in all then, last weeks technical numbers were not only impressive in scope, but it also forecasts many good things for the United States equity markets moving forward if we continue to get the good follow through that would be necessary and expected to keep things "looking up".
But to be clear, there's still more work to do before we "get set" and then a "go" for a confirmation of an new uptrend being in progress.
The total market continues to move in a constructive configuration with the NASDAQ and AMEX cumulative volume charts leading their breadth counterparts after both finding good support at their 1% trend (200 day EMA) lines of support. And though this continues to be more of an annoyance than anything, the NYSE cumulative A/D volume is still bringing up the rear with respect to the A/D breadth, but both did generate enough power in last weeks move to break above their faster EMA's, and this should be respected for what this can suggest for the future health of this marketplace.
So in this particular area, we should pay special attention to this near term NYSE imbalance as this could be nothing more than holiday related influences distorting this picture - but at the same time - makes next week important as to providing any additional clues for continued conformational follow through that would be needed for the sake of this same money flow structure as a whole.
The next technical expectation for the cumulative A/D patterns near term is to get the 20 day EMA (10% trend) to move back above the 40 day EMA (5% trend) and then act as support to the present initial impulse move. This would be the "get set" signal mentioned above, with a "go" when the actual data line makes higher highs than that of the initial peak of this current run while still maintaining this constructive moving average configuration. This also pretty well sets the bullish and bearish case for the market near term, where a failure to move as suggested above could then open the door for some kind of aberration to the pattern overall.
One of the more important things in which you don't want to see if you're negative on the market would be for the various cumulative lines on this page generating higher data point highs than what were seen in the first quarter of 2004, which going by the McClellan Oscillator readings of this past week, will be easily challengeable over the next 4-6 weeks. In this area of analysis, this would be both the bulls and the bears "line in the sand" to any further price appreciation from what the initial thrust of last week's move suggests.
Another area would be if we see the cumulative new highs/new lows data making new highs as well in conjunction to any further constructive advance/decline data that we may see from this juncture.
The one last area that I would like to touch upon was the talk last week about the seemingly weaker price action in which would be perceived as a possible negative for the short term. One could point to several ideas when it comes to this and what it may mean, but probably the better answer to why this happened would be found within what the McClellan Summation Index suggests. When using this tool, many accelerated price moves tend to happen between the -250 and +250 levels, and where last years price advance will give a better picture to why this would occur in the first place - as it was harder for price to move lower with the high Summation readings until we moved closer to the zero line. Now, it's hard for price to rally with this same tool showing the negative extremes as it previously had.
With the breadth NYSE RA MCSUM at a reading of -297 (after being as low as a -750), any dramatic price moves in the NYSE group of stocks to the upside should now only start to take place as we move into this "volatile" Summation zone....and this can occur as early as this coming Tuesday. This would also mean that with a reading of -611 on the NASDAQ breadth MCSUM, it's still going to be a bit before we'll probably see any real upside movement, and this will probably be used as one of the reasons why we'll pull back near term based on the "overbought" nature in which the market now enjoys.
Currently then, common sense would suggest that we're certainly due for some sort of rest near term as sentiment took a dramatic leap to the bullish side with the impressive nature of last weeks internal and price advance, though the momentum of this same move may carry on for another day or so. With the key unemployment report coming out next Friday of this shortened trading week, let's go for a firm Tuesday, a more pronounced rest to digest the previous gains made on Wednesday into Thursday, all in preparation for what should be perceived as good news for the market no matter what the numbers show this coming Friday.
If the number comes in higher than expected, this could then rethink the idea of a possible interest rate increase at the end of June - or - a lower number could be received as good for potential earnings news - and with an interest rate increase more than likely discounted now after the last two months of correction - this kind of "key" data could be all that will be needed to really kick the market into high gear.


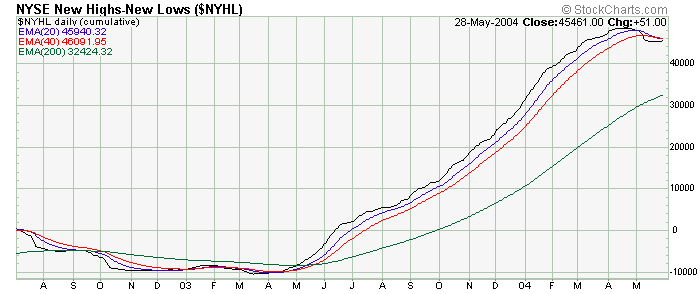


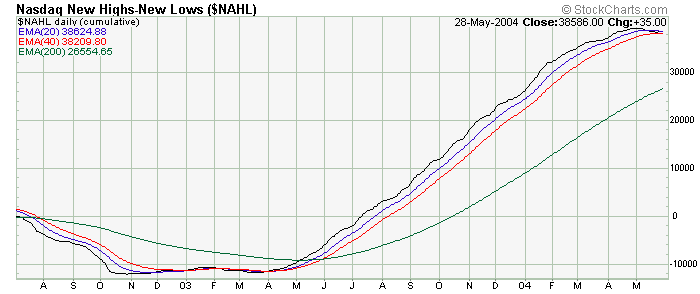


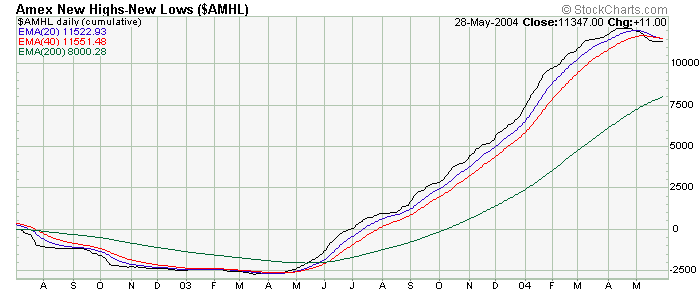
The above charts are courtesy of StockCharts.com
Comments provided are for informational purposes only
and not intended for trading purposes.
 Back to Top
Home Page
Back to Top
Home Page
Copyright © 2002-2004 Technical Watch