
Cumulative Data
Week Ending 6/25/04
"So based on all of this information, let's again give the nod to the bulls, and look for a higher Monday, and if the tone is solid, a continuation into Tuesday and Wednesday, where Thursday and Friday could provide our next breather before we go into the following week's Fed statement on Wednesday the 30th - and where keeping an eye on the NASDAQ advance/decline breadth ratio might not be a bad idea."
Well, I think I can safely say that last week's forecast didn't pan out as expected, though the bullish internal tone of the market did continue to get nice follow through.
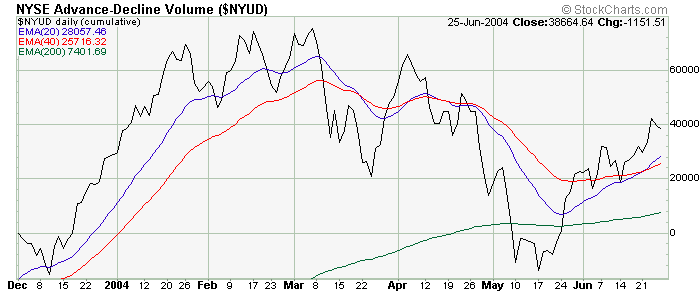
The NYSE cumulative A/D volume is now on a "go" buy signal and continues to lead breadth to the upside. The 20 day EMA (10% trend) will now act as technical support for this same buy signal, and where the 40 day EMA (5% trend) will act as the demarcation point of a possible sell signal.
After finding key support at the intersection of the faster EMA's a little over a week ago, the NYSE cumulative A/D breadth has joined the A/D volume on a "go" buy signal. The next technical expectation is a test of the all time double top highs of March.
The NYSE price/McClellan Summation Index chart continues to look constructive with price breaking out to the upside on Wednesday with a larger separation of the daily postings on the Summation Index confirming the move. As marked on the chart below, the April rollover highs is now within a week away from being challenged, and we need to move above this area if new recovery price highs are to be seen during this current advance. With the Summation Index now in it's sixth week of moving up from the May lows, history suggests that we may be closer to a market rest to allow the Summation to move back to or towards the zero line in the not too distant future.
Conversely, a move above this same Summation April high water mark, accompanied by post expansion of the data at the same time, would suggest that we'll probably be in store for another one or two weeks of higher postings which would then find it's next resistance point at the highs of early March at the 786 level.


The cumulative TICK remains strong, while the cumulative new highs/new lows generated a "go" buy signal last week.


Bottom Line: The NYSE is now on a solid buy signal at this time, and where clearing the April "hump" highs on the McClellan Summation Index would then allow the price action to move to recovery, and in some indices, new all time highs.
After testing it's 5% "trend" line for the third time in as many weeks, the NASDAQ cumulative volume generated a "go" buy signal last week, and continues to lead breadth to the upside.

NASDAQ cumulative breadth is now looking more constructive with near term bottoms above bottoms now in place. It will be important for this data to now move not only above the 40 day EMA (5% trend) to generate an "on your mark" buy signal, but any move above the 1% trend (200 day EMA) in the next week or so will be very constructive for this marketplace overall as it should then pull the 10% index (20 day EMA) above the 5% index (40 day EMA) concurrently .
The NASDAQ price/McClellan Summation Index chart shows the same constructive price breakout pattern with that of the NYSE with a larger daily post separation to the upside confirming the move. And like the NYSE, a move above the April highs would then allow price to challenge the highs made earlier this year.


The cumulative TICKQ chart continues to ride the 10% "trend" line showing a good continuing flow of capital coming into this exchange. Any higher highs in the next several days would be very bullish in light of what the cumulative volume chart is indicating at this time.
The cumulative new highs/new lows is within a whisper of taking out the April highs which would add additional evidence to which direction the path of least resistance truly lies near term.


Bottom Line: A good week overall for this exchange, not only internally, but price relative strength is now leading the NYSE to the upside which makes for good overall strength of the current advance.
As with the NYSE and NASDAQ markets, the AMEX continues to support a bullish configuration with cumulative volume leading cumulative breadth to the upside. Additionally, AMEX cumulative volume generated a "go" buy signal this past week with breadth still in "get set" mode. The cumulative new highs/new lows data also generated a "get set" buy signal this past week as well.


Conclusions: The NYSE continues to lead the rest of the market higher, and liquidity continues not to be a problem to sustain the present price advance. The mid and small cap sectors, as reflected by the Russell 2000 and S&P 600 index' (the SML closed at all time weekly highs on Friday) continues to lead the charge, with the NASDAQ now showing that it has legs of it's own.
With a very busy week of data being presented for the markets to digest, from personal income and consumer confidence readings on Monday and Tuesday, the PMI data and FOMC meeting results on Wednesday, and then finishing up the week with construction spending, the ISM index, and the unemployment figures coming out Thursday and Friday, there shouldn't be too much in the way of market apathy.
And when you combine all of this with a historical firm seasonality period going into next weeks holiday weekend, and many of the price indices now in bullish configurations of their own, one would have to again give the nod to the bulls when the trading week is all said and done.
However, with everything looking so good, and the Summation Index approaching some key overhead resistance levels, it also might be time for a pullback and/or some near term disappointment creeping into the marketplace...so I'm going to forego any directional forecasts for this week, and let the marketplace itself be the ultimate arbitrator.
The above charts are courtesy of StockCharts.com
Comments provided are for informational purposes only
and not intended for trading purposes.
 Back to Top
Home Page
Back to Top
Home Page
Copyright © 2002-2004 Technical Watch