
Cumulative Data
Week Ending 7/16/04
With the (NYSE) breadth McClellan Summation Index itself at levels in which "overbought" readings are generally acknowledged at the +500 level, along with the divergence noted on the chart, the expectation of an internal pullback over the next couple of weeks can now be entertained...With the idea of the 9 month cycle bottom still due to nest in the early part of August, along with the breadth Summation Index of the NYSE previously suggesting that a trading range with an upside bias still to be considered, the month of July could continue to be frustrating to both the bulls and the bears for the better part of the month. And with the continued buoyancy of price itself, it will more than likely continue to be a market of stock picking than that of an overall trending market in either direction on a short term basis (that of a 2 to 4 week duration).
The general marketplace continues to be one of a market of stocks than that of a stock market, where depending on where you look, one can now make a case either way on how all of this will eventually turn out later on.
(Personal note: My sincere thanks to those who sent well wishes to me over the last week. Your kindness during this time was very much appreciated.)
After finding resistance at the mid April high point, the NYSE A/D cumulative volume chart is now on a sell signal, with a retest of the 200 day EMA (1% trend) the most likely near term expectation. This should also bring the faster EMA's down where a dip below this same "trendline" would occur concurrently, and where a better bottom can be set for a more robust rally than that of the last two months.
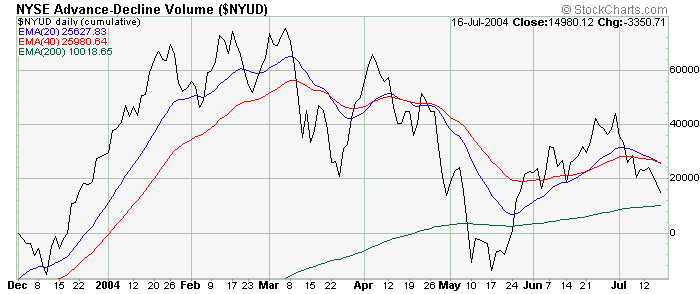
The NYSE breadth of market has held up admirably during the last two weeks of broader market price weakness, and this is good news and bad news overall. The good news is that, with the present position of the A/D volume, money continues to find its way into stocks that tend to have better earnings and/or dividend track record than that of the NASDAQ exchange.
However, the bad news is two fold. Firstly, having the NYSE being the beneficiary of whatever cash is coming into the market, shows a market of either institutional or futures weighted participation, and doesn't lend itself to moving prices higher in a general sense.
The second piece of bad news is that this continuing wave of positive money flow has now kept the McClellan Summation Index moving in this same direction for a longer period of time than what is usual and customary. And when you add the fact that the NYSE MCSUM has remained above the +500 level, which is historically a level in which the market tends to exhaust itself to the upside and soon turns down to or towards the zero line of neutral, the odds are pretty good that a reversal of fortunes should be seen very soon to play some sort of catch up to what the NASDAQ market price pattern has already traced out over the last two weeks.
Another negative is that if the A/D line does start to move down from this present level, this would leave behind a potential double top formation which would have additional negative forecasting ability for this exchange overall (no less the negative divergence noted between volume and breadth itself).


The NYSE TICK and cumulative new highs/new lows charts continue to support a firm exchange environment, and these data charts reconfirm what the A/D breadth chart shows above - that being - that this is the exchange of choice at the present time.


Bottom Line: The NYSE has seen very little in the way of price decay in the face of what the NASDAQ exchange has endured over the last two weeks. However, with the present position of the NYSE breadth McClellan Summation Index, there's still a very good possibility that a shake out of some kind, to match what the NASDAQ exchange has done over the last couple of weeks, could materialize to correct this inter exchange imbalance in the not too distant future.
The NASDAQ cumulative advance/decline volume chart has literally fallen out of bed in the last two weeks after finding resistance at the late April high point, and is now on a sell signal.

Having been the ugly sister of the overall market advance from the May price bottom, the cumulative NASDAQ A/D breadth chart now looks as though this same sister was hit by a truck.
The latest move in late June, and subsequent divergent failure (with price), has now moved this data below the May lows confirming the negative price move within this same time frame.
The really ugly part is that this latest failure has internally caused both a price and McClellan Summation Index failure which is a highly negative event for the short term.
With volume, breadth, and price now moving effortlessly to the downside, it shouldn't be long now before continued price erosion should take place, minus any "dip" buying that might materialize near term.
It's also worth noting that with price breaking below previous spring support with Friday's close, it's now highly probable that the measuring objective generated by the "right angle triangle" shown on the chart below should be the next price objective for the current decline.
The only near term question with as oversold as we are in many technical indicators and with the NYSE teetering is...will this event take place sooner (within the next week) or later (sometime in August)?
In any event, everything is now pointing to continued price erosion for this exchange, and where watching these same indicators building divergence will be important as to where a key bottom may materialize later on.


The NASDAQ TICKQ continues to remain constructive by finding initial support at its 40 day EMA (5% trend). As long as this intermediate "trendline" continues to support the present data pattern, the current price decline should be viewed as another pause in the uptrend from last year - and where a definitive breakdown from these levels would be telling a different story.
After making new all time highs 2 weeks ago, the cumulative new highs/new lows data chart has been aggressively unwinding to the downside suggesting that its hard to find areas on this exchange immuned to the present softer bid action.
It will be important to watch how the 10% trend reacts when it moves lower to the 5% trend as to how destructive further price erosion might be overall going forward.


Bottom Line: The NASDAQ exchange continues to be the weakest of the three exchanges covered in these updates. Last week's price decline, along with the cumulative A/D charts confirming this decline, has now generated lower price level objectives for the exchange overall for the short term.
The AMEX is now following the NASDAQ's path of least resistance, and is now on sell signals as it applies to both A/D charts, with the new highs/new lows cumulative chart not too far behind in generating a sell signal of its own.


Conclusions: For the better part of this year, the marketplace has continued to give mixed signals as to what the eventual outcome will be of the high level consolidation patterns that are apparent on many of the index charts at the present time.
The volume versions of the McClellan Oscillator (not shown) are now deeply oversold, and a reflex rally of some sort should be expected in the market, in general, by the middle part of next week.
The Open 10 ARMS Index, which is a 10 day moving average of the TRIN indicator itself (advance/decline ratio divided by the advance volume/decline volume ratio), is now as oversold as its been in over 3 years, if not historic. The Bollinger Put Volume Indicator (PVI) generated a buy signal last week, while the Climatic Volume Indicator (CVI) also went to levels in which good long entry points have developed in the past.
And all of this happened with one exchange, the NYSE, losing 3% of its value, the NASDAQ index losing 9%, and the AMEX gaining 3% and closing less than 4 points from an all time high reading after Friday's close.
Definitely allot to consider if you're technically trading the market. Do we find a bottom near term, rally to relieve the oversold readings recently generated, and then decline below the 200 day EMA to reverse the continuing high numbers of opinion as it relates to sentiment? Or has the last two weeks been just excuses for those fence sitters that wanted a reason to close positions because of the lack of upside volume with the last advance from mid May??
Then again, some of this could be a manifestation of expiring July options, but the last half hour on Friday showed futures traders not willing to keep a position, either long or short, over the weekend.
So, for right now, its a bit of a tough call as to the probable resolution of this mixed bag of information being presented this week.
Being open to the idea that the 9 month cycle is still scheduled to bottom by the ides of August, and with the harmonic half way nesting point of the 4 year cycle still in front of us (October plus or minus two months), the rest of July will probably continue to frustrate both bulls and bears alike in the area of an overall trending moves until the beginning of August at the earliest.
Until that time, and with the information shared in this weekly review, let's look for some sort of firmness in the price patterns starting by Tuesday, which should then lead to some choppy price appreciation into the end of July.
And if the spring of this year's decline is any indication of what to expect from this juncture, a more pronounced and broad based decline to occur in the month of August, and maybe into September, which will hopefully shake the confidence of the complacent bullish sentiment that continues to nag of the current marketplace personality will finally be purged in order to set a more proper price bottom in which the market can then attempt to move importantly higher.
The above charts are courtesy of StockCharts.com
Comments provided are for informational purposes only
and not intended for trading purposes.
 Back to Top
Home Page
Back to Top
Home Page
Copyright © 2002-2004 Technical Watch