
Cumulative Data
Week Ending 8/20/04
As we continue to move through the month of August, things seem to be running quite smoothly as it relates to the general marketplace. The internal lows for the upcoming 9 month cycle price bottom, which is due in early September, bottomed pretty much on schedule on Thursday, August 12th, two days after the forecasted target date of August 10th. Many other technical measurements of breadth and volume also put in divergent lows in this time period as well.
But this is only a start as this weeks charts continue to suggest that there's still some work to do before a foundation is built in which price can then rally importantly.
This week I have replaced the McClellan Summation Index with the McClellan Oscillator on the exchange price charts shown below. By paying attention to the positions of the 20 day and 40 day EMA's on each of the cumulative charts posted on these updates, this will give you another way to view the approximate current position of the Summation Index itself, where a cross between the 20 day and 40 day EMA's would be consistent to the Summation Index' zero line of neutrality.
For those who may be either new to these updates, or just to this area of market analysis, further information on both the of these technical tools can be found by clicking here for the McClellan Oscillator, and for the McClellan Summation Index, clicking here.
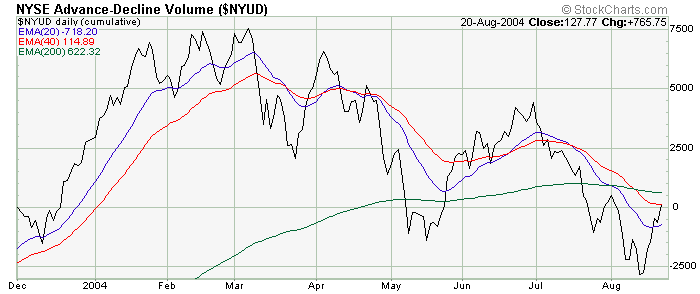
The NYSE cumulative advance/decline volume line has now moved back towards it's 5% trend (40 day EMA) after finding it's bottom 10 days ago. This present configuration is also near the highs seen at the beginning of August adding additional resistance to the pattern.
With the continuing bearish configuration of this data - the 20 day leading the 40 day, which is leading the 200 day EMA to the downside - continued caution is suggested until we see this data first move back above the 1% trend (200 day EMA), and then having the 20 day EMA cross back above the 40 day EMA to lock in the most recent lows just recently seen. This kind of action would then reinforce the notion that the present price advance has legs to stand on. With the month of August generally the slowest trading month of the year, it's probably going to take a couple of weeks yet before we see any real constructive movement in this indicator.
The NYSE cumulative A/D breadth chart is now within a whisper of setting new all time highs after not only finding EMA support to the pattern being traced out over the last month, but this same pattern has also left a double bottom formation behind in the July/August period suggesting good internal strength to the pattern itself.
However, with the cumulative volume data lagging at this juncture, we presently have a non confirming move between what is the heart (volume) and breath (breadth) of the animal that we're dealing with. This would also suggest that with breadth leading volume, the current action of the last week or so is coming in on the buy side, with the lack of volume highly suggesting that this buying is more internal than any fresh money entering the exchange at this time.
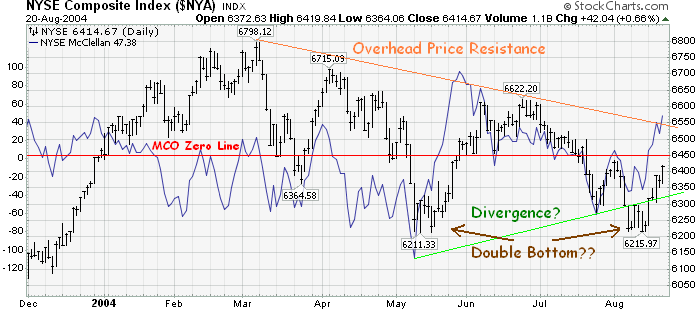
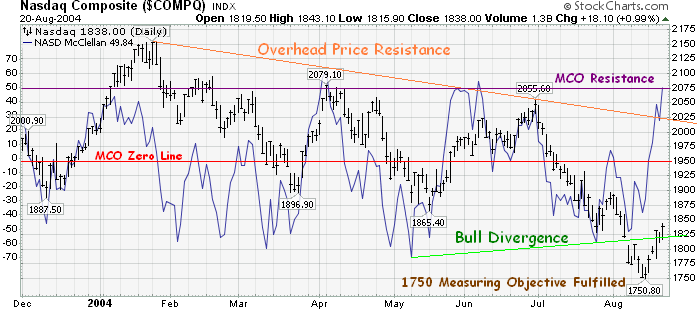
As mentioned above, with this weeks update we're turning our attention to the companion tool to the McClellan Summation Index, the McClellan Oscillator, with the daily price chart overlay. Being an indicator of the shorter term trending momentum of the cumulative A/D breadth line, the Oscillator will generate what are called divergent moves that directly relates to the price action being witnessed. The current chart below gives an example of this idea. What you will notice, as marked by the green "divergence" line, is that while price had been making lower lows, the momentum, or thrust of the move, has been dissipating with each successive price low shown on the chart.
Structures like this are called "bull divergence" formations, and suggests that the price move being witnessed was in its final stages of exhaustion.
However, as you will see later on with the NASDAQ price chart shown below, the price chart of the New York Composite didn't quite take out the price lows that were generated in the May period for this same divergence to be called "clean". But if you look closely at the MCO in relation to the price lows made in August, you will also notice that a bottom above a bottom pattern did materialize on the MCO as it directly relates to this same price structure, which does open the door that a possible double bottom in price has now occurred as it relates to this index price chart.
What will be important for the near term is that the NYSE MCO will need to stay above the zero line shown on the chart for the majority of the time over the next week or so, or it can then be said that the bulls have NOT wrestled control away from the bears, and where a retest of this same price pattern would then be in order. With the cumulative A/D volume still needing to confirm what the A/D breadth chart is showing at this time, no less that the McClellan Summation Index has yet to fully go to or below the zero line to complete the internal correction necessary to set a firm bottom in which to rally out of, one should continue to maintain a wait and see attitude until the heart and lungs of this exchange are more in line with each other.
The last point I would like to make this week with respect to this data is that with the A/D breadth now taking out the highs of July, this now cancels the previous downside price objective given two weeks ago on the last update, with the overhead price resistance line now back to the forefront as to any further price objectives that might materialize as we move along from this juncture.

The cumulative TICK continues to move higher, with the angle of ascent increasing over the last two weeks. This continues to suggest that liquidity is good on this exchange where any unexpected surprises should be cushioned by this same liquidity factor...very much like when pushing a basketball below the water line of a swimming pool, and then when released, price should then be able to rebound accordingly.
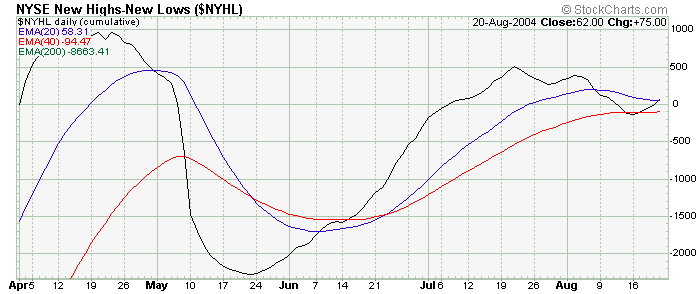
The NYSE cumulative new highs/new lows found support right at the 40 day EMA (5% trend) and has also bounced higher over the last week. It will be very constructive if this indicator can move back above the 20 day EMA (10% trend) as this would confirm the recent action of the cumulative A/D breadth line shown above as something that would need to be respected for what it implies.

Bottom Line: The NYSE continues to be the strongest of the three exchanges, but the internals are not in what would be generally accepted as constructive at this time. Any additional move above the all time highs in the breadth chart without the A/D volume line in a bullish configuration of it's own, should be suspect to a near term failure of the pattern, and where another pullback to regroup would be highly anticipated. It is the expectation at this time that this regrouping period will coincide with the upcoming 9 month cycle price bottom which is due on or about September the 10th.
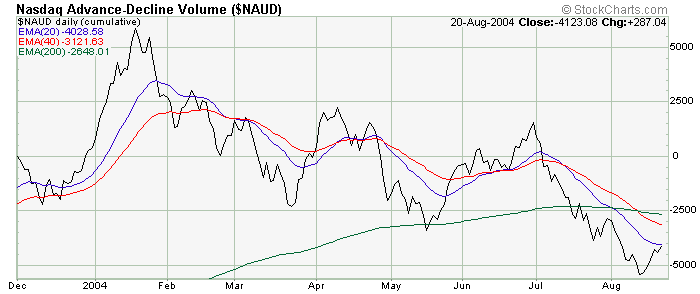
The NASDAQ cumulative A/D volume line also bottomed on August 12th, and has so far struggled to get to it's fastest EMA, the 10% trend. To help confirm that a bottom is indeed behind us, a move back above the 5% trend would be helpful in this respect. But since volume will more than likely be slow for the rest of this month, all that will be important for the near term is that the lows made earlier this month remain intact on any future price weakness.
Like the volume line, the NASDAQ cumulative A/D breadth line also has allot of work to do in its attempt to construct a base in which to move higher. And like the NYSE, breadth is leading volume at this juncture which suggests that the current price advance will fail eventually unless this turns around. The only important thing to watch for right now is, like the NASDAQ volume, that the lows made 10 days ago hold on any further price erosion that might materialize over the next couple of weeks.
The NASDAQ McClellan Oscillator/price index chart shown below shows a better example of the divergence that has been generated between these two comparisons. It is also worth noting that this multiple divergence pattern was generated right at the price objective given for this exchange back in July at the 1750 level which is compelling evidence that this exchange is now attempting to build a base from this same price low. However, there are other methodologies that suggest that this 1750 level will not hold if we do get a pull back to better set the foundation of the internals, so the stability of these same internal lows will be the key as to whether a more substantial decline is still in the offering.
And like the NYSE MCO, failure to hold above the zero line over the next week or so would also suggest that the bears are still in control, and more importantly, we will still have more work to do before all the willing and unwilling sellers are fully flushed out so that we can indeed move importantly higher from these same price levels.

The cumulative TICKQ is supporting a very bullish configuration where we went down to test the levels below its faster EMA's, and now has not only moved back above these same EMA's, but it was also able to generate new recovery highs in the process. Needless to say, this carries bullish overtones as it relates to the current liquidity factor this exchange faces, where confirmation by volume and breadth would be considered a large positive development for the intermediate term.
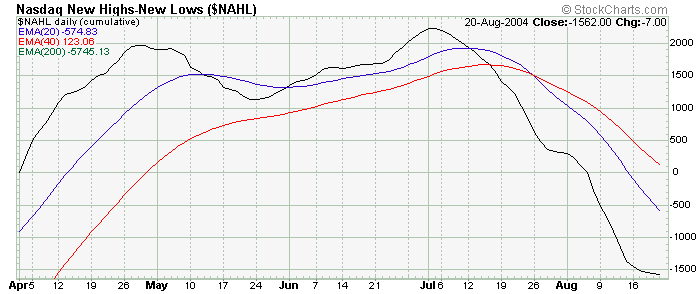
However, the cumulative NASDAQ new highs/new lows data is continuing to look rather sickly, reflecting the softness of the advance/decline data shown above. And like the cumulative advance/decline data, it's going to take some time to construct a better base where prices could then advance, and more importantly, hold that advance.

Bottom Line: The NASDAQ exchange continues to be the weakest of the three exchanges. Having now fulfilled the downside price objectives, along with the idea that the 9 month cycle lows of the internals coming in pretty much on schedule with this event, a neutral stance would be the best suggestion at this time while looking for additional evidence of better bottoming formations being constructed over the next couple of weeks.
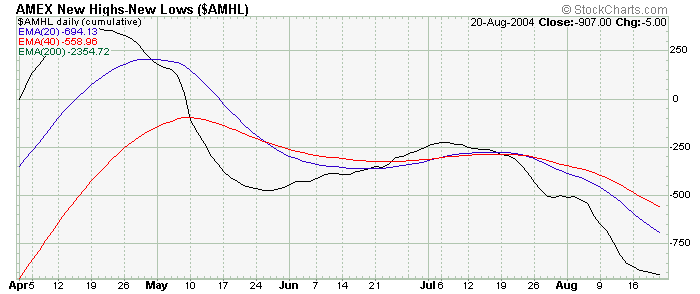
Like the NYSE and the NASDAQ, the AMEX cumulative charts also bottomed on August the 12th. But unlike the other exchanges, here we have volume leading breadth to the upside probably because of the outstanding performance that the precious metals stocks had last week. This exchange also showed good positive divergence between the cumulative volume and the cumulative breadth which suggests that the stocks on this exchange are buoyant. However, you can also see that we have additional work to do before one can say that we're in the clear, so pick any longs in which you may want to play carefully, and utilize tight stops in case of any upcoming stumbles that may hit the marketplace over the next couple of weeks.


Conclusions: Though things seem to be running smoothly, it's now "construction time" to repair the damage that the downtrend from the early July highs created. In this case, constructive evidence would be where bottoms above bottoms are evident, the cumulative data is generally advancing, and most importantly, the respective EMA's better represent a positive configuration. Until we see this kind of action then, the weight of evidence will continue to side with the bears.
On the bullish side, one has to be impressed with how the market has held up relative to what the crude oil market has been doing over this same time period, no less the geopolitical news events that has accompanied this increase in the cost of running the economic engine. One also has to be impressed with the amount of liquidity currently being reflected by the NYSE A/D breadth line, no less the junk bond market making new all time highs during this same time period which also suggests that the cost of money is actually moving positively (lower interest rates) than what would be usual and customary under these same conditions on a historical basis.
As briefly mentioned above, many other derivative technical tools that use this same cumulative A/D data have built divergent bottoms with price - very much like we see with the McClellan Oscillator at this time - which suggests that we're getting close to a price bottom, if we haven't accomplished this feat already.
With two weeks left in what is usually the slowest trading period of the year, the Olympics in Greece winding up next Sunday, the Republican Convention starting the following Monday, and then finishing up with the Labor Day weekend holiday two weeks from now, the market will be open to volatile moves dependent on the news of the day, and at the same time, could very well be net neutral when all is said and done.
Because of this, unless new lows are made with respect to the A/D charts over these next two weeks, a neutral stance is now suggested to be maintained while continuing to perform due diligence on making lists of those stocks that would be potential leaders dependent on the actual direction we eventually take after the upcoming holiday period.
The above charts are courtesy of StockCharts.com
Comments provided are for informational purposes only
and not intended for trading purposes.
 Back to Top
Home Page
Back to Top
Home Page
Copyright © 2002-2004 Technical Watch